- DATE:
- AUTHOR:
- The Altmetric team
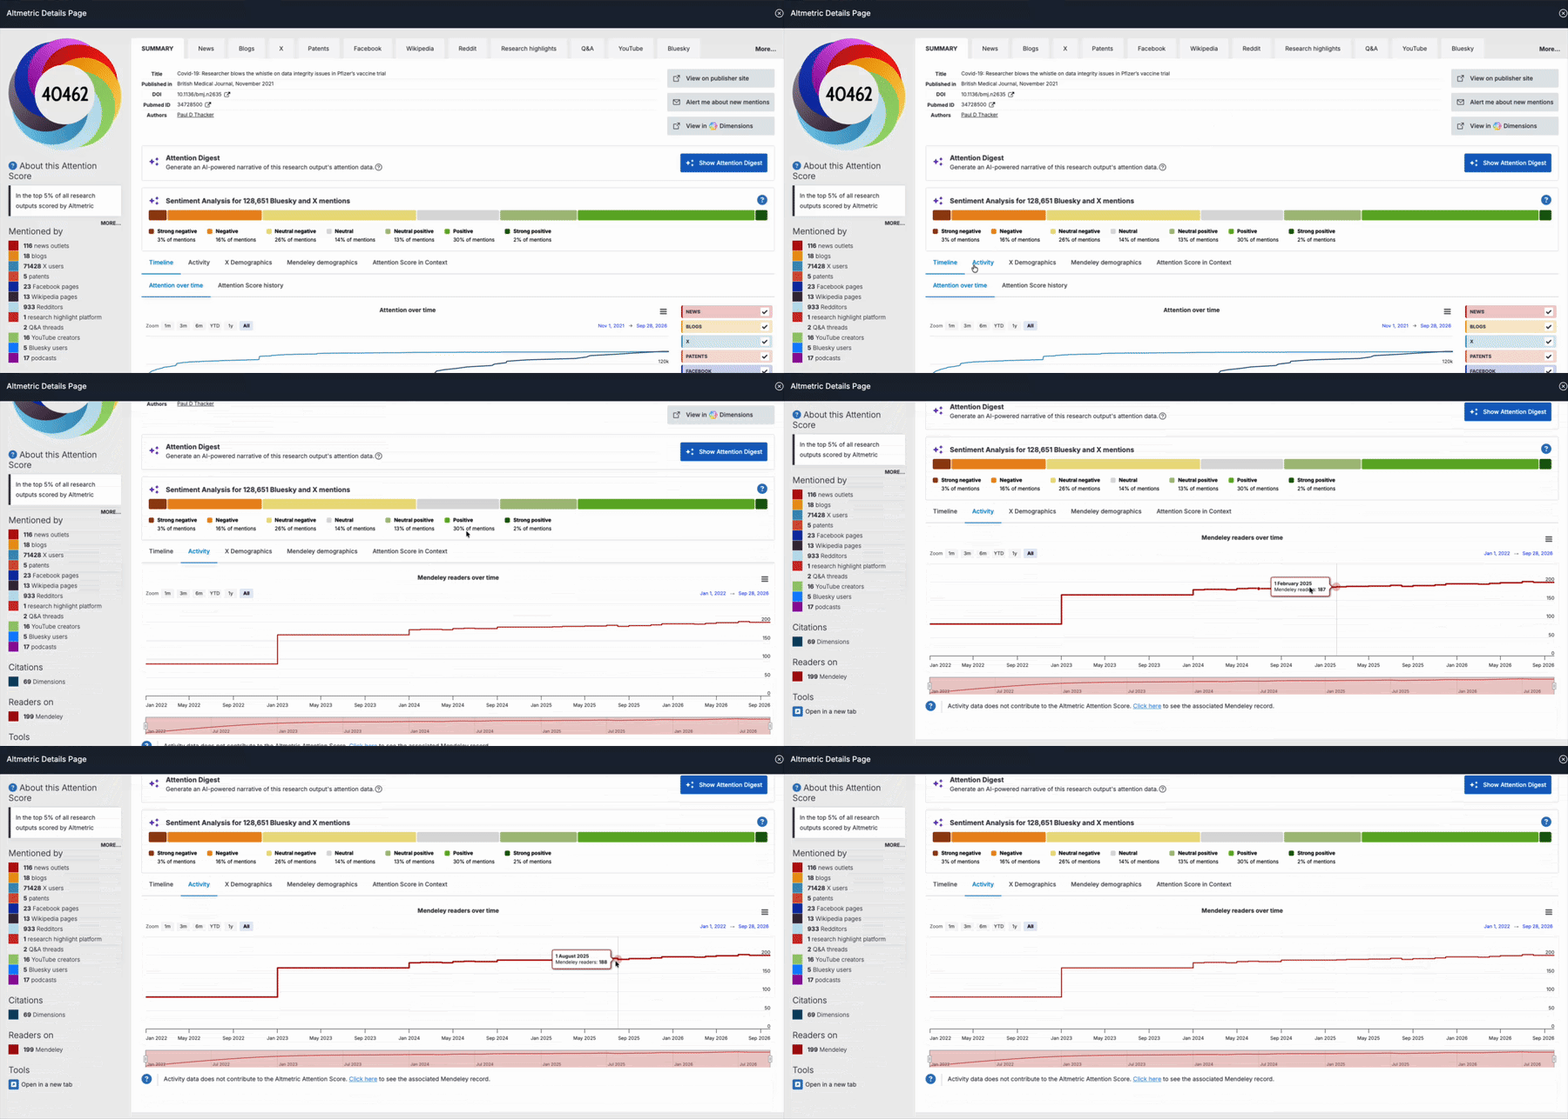
Mendeley readership history timeline on Details Pages
Mendeley reader counts are one of the most established signals of active engagement with research we currently track: Mendeley readers are largely researchers actively saving an output to read or cite, showing professional engagement that mention counts alone don't show.
Until now, Details Pages could only show where the count of Mendeley readers stands today. When you're trying to tell whether a research output's readership grew steadily, spiked around a specific event, or picked up again after a long quiet period, a single number only paints a partial picture.
Our newest feature is designed to close that gap, giving you the same kind of historical view for Mendeley readers that you already have for the Altmetric Attention Score.
What's new?
We added a new, interactive timeline that shows how an output's Mendeley reader count has changed over time. It will help you:
Add a time dimension to a familiar number, moving from "this many people have saved my research output on Mendeley" to "here's how that readership built up."
Identify whether activity was immediate, gradual, or renewed after a period of dormancy.
Notice when reader growth lines up with other activity you're tracking outside Altmetric, such as course adoptions, citations, or media coverage.
The chart is available to all Explorer subscribers with access to Details Pages, as well as all Altmetric Bookmarklet users.
Logged-out visitors will see a prompt to log in to Explorer to see the chart. This does not affect the Mendeley demographics tab, which stays free and unlocked for everyone.
Key features
The chart lives in a new Activity tab on Details Pages, visible next to the existing Timeline tab. The Activity tab only appears for outputs that have Mendeley readers: if an output has none, the tab won't appear.
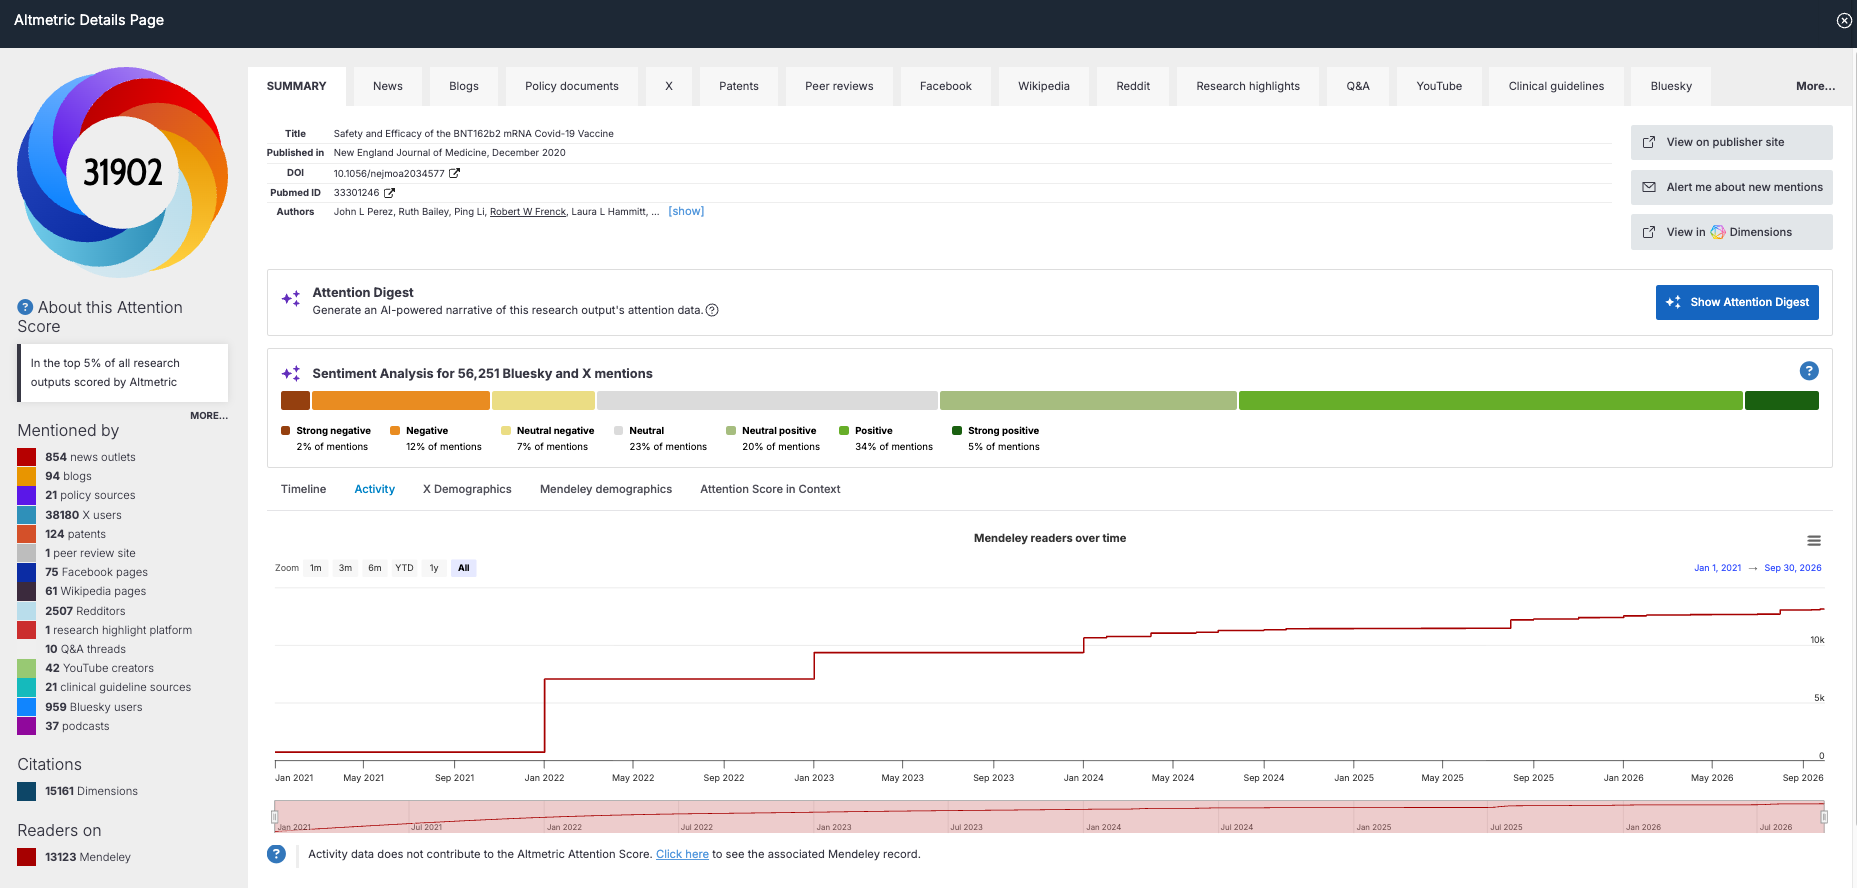
Hover over the line chart to see the reader count at that point in time.
Explore flexible time windows to frame the trend you need to show.
Replace screenshots and partial exports with a single chart ready to share: export timeline data in PNG or CSV format for author reports, funder submissions, leadership decks, compliance documentation, and horizon scans
Jump to the full Mendeley record for the output directly from the chart.
Notes on data availability
Data coverage is available from 2021 onwards. As historical data is assembled from multiple data sources, the frequency of the data points on the chart varies by time period:
Between 2021 - 2023: yearly data points
January 2024 to August 2026: monthly data points
September 2026 onwards: weekly data points
Please contact the Altmetric Support team for any further questions, we'll be happy to help!