- DATE:
- AUTHOR:
- The Altmetric team
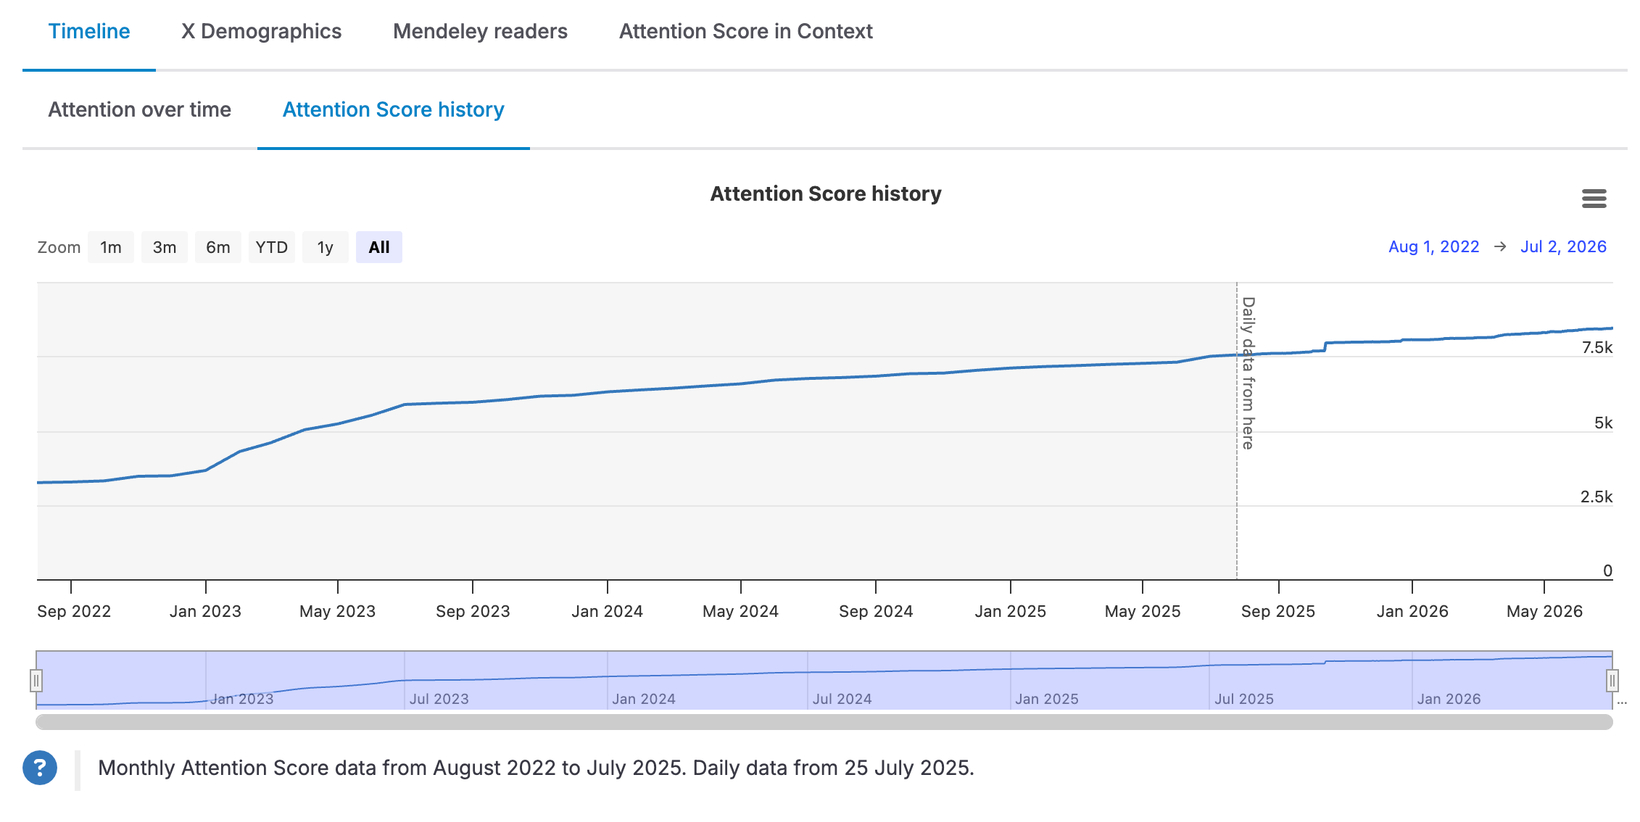
Attention Score History timeline on Details Pages
The Altmetric Attention Score is one of the most recognizable data points we offer. Until now, users could only see where the score stands today, not how it got there. When demonstrating journal reach to authors and societies, building evidence for REF submissions and funder reports, linking dissemination activity to measurable outcomes, or tracking whether emerging research is gaining sustained traction, a point-in-time number only paints a partial picture.
Our newest feature is designed to give you more visibility into how attention developed over time, so you can better distinguish sustained trends from momentary spikes, notice when score changes align with key events you're tracking, and surface renewed interest in older outputs that might otherwise be overlooked.
What's new?
Our brand new Attention Score History Chart adds an interactive timeline to the Altmetric Details Pages you already use, showing how each output's score has evolved since August 2022. It will help you:
Add a temporal dimension to research monitoring, moving beyond "my research is being discussed" to "attention to my research has been evolving".
Identify whether attention grew steadily, peaked at launch, surged at a specific point in time, or experienced renewed interest after years of dormancy.
Notice when score changes align with specific activities you are tracking outside of Altmetric, such as promotional campaigns, policy citations, media coverage, etc.
Distinguish sustained, meaningful engagement from one-time spikes, to prioritize where to focus next
The Attention Score History chart is available to all Explorer subscribers with access to Details Pages, as well as all Altmetric Bookmarklet users.
Key features
The feature lives within a new Timeline section on Details Pages, which now contains two visualizations, each with its own dedicated tab: the existing Attention Over Time chart, and the new Attention Score History chart.
The Attention Score History tab only appears for outputs with a recorded score. If the score is zero, the tab won't appear.
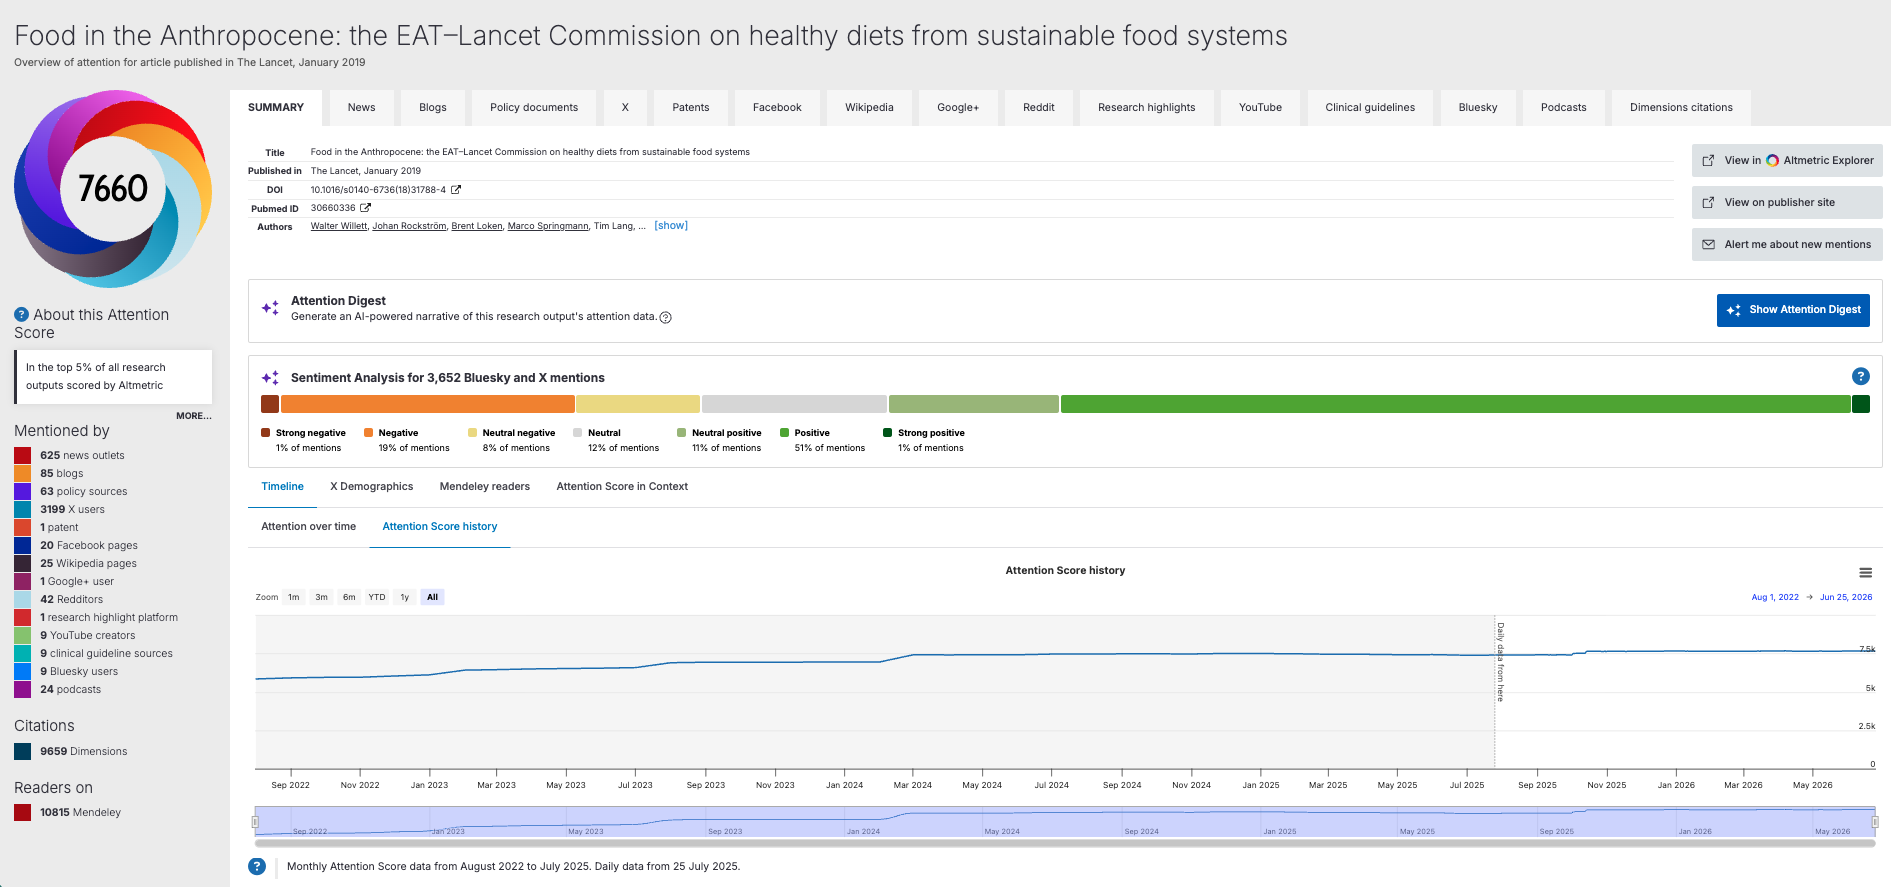
Hover over the line chart to see the score at that moment in time
Explore flexible time windows, weekly to all-time, to frame the story you need to tell
Replace screenshots and partial exports with a single chart ready to share: export timeline data in PNG or CSV format for author reports, funder submissions, leadership decks, compliance documentation, and horizon scans
Notes on data availability
Data points between August 2022 and 25 July 2025 are monthly snapshots; from 25 July 2025 onwards, they are daily (as per the images below). Monthly snapshot data before 25 July 2025 is only available for outputs that are also tracked in Dimensions.
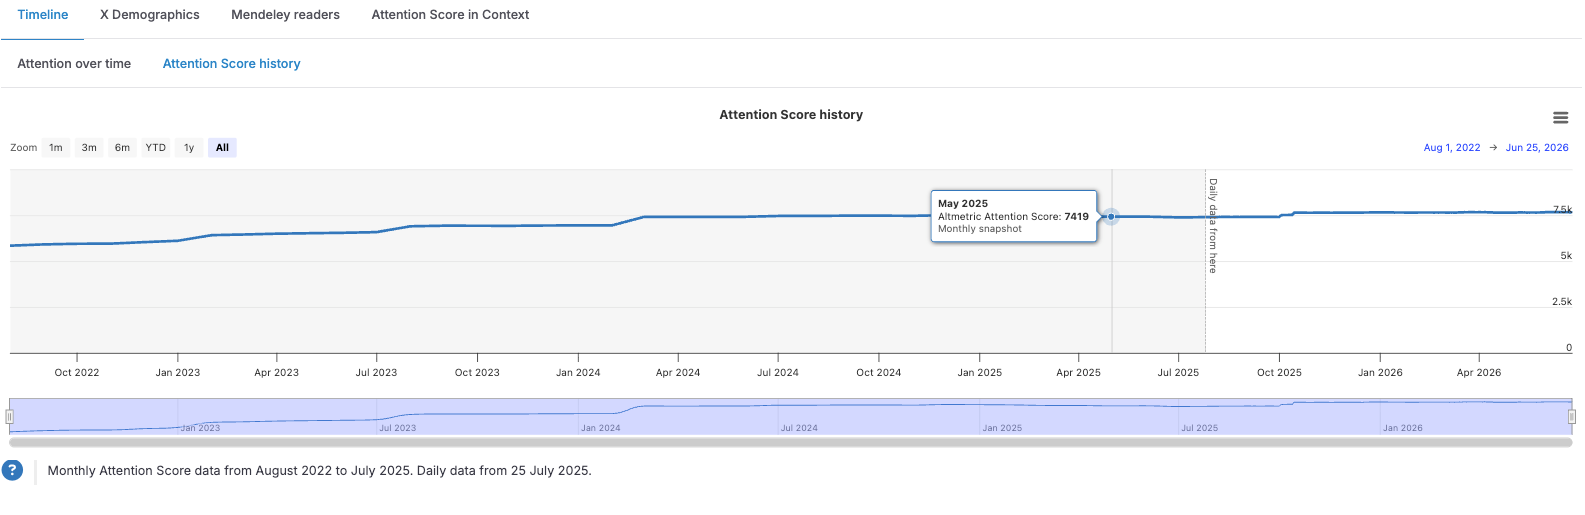
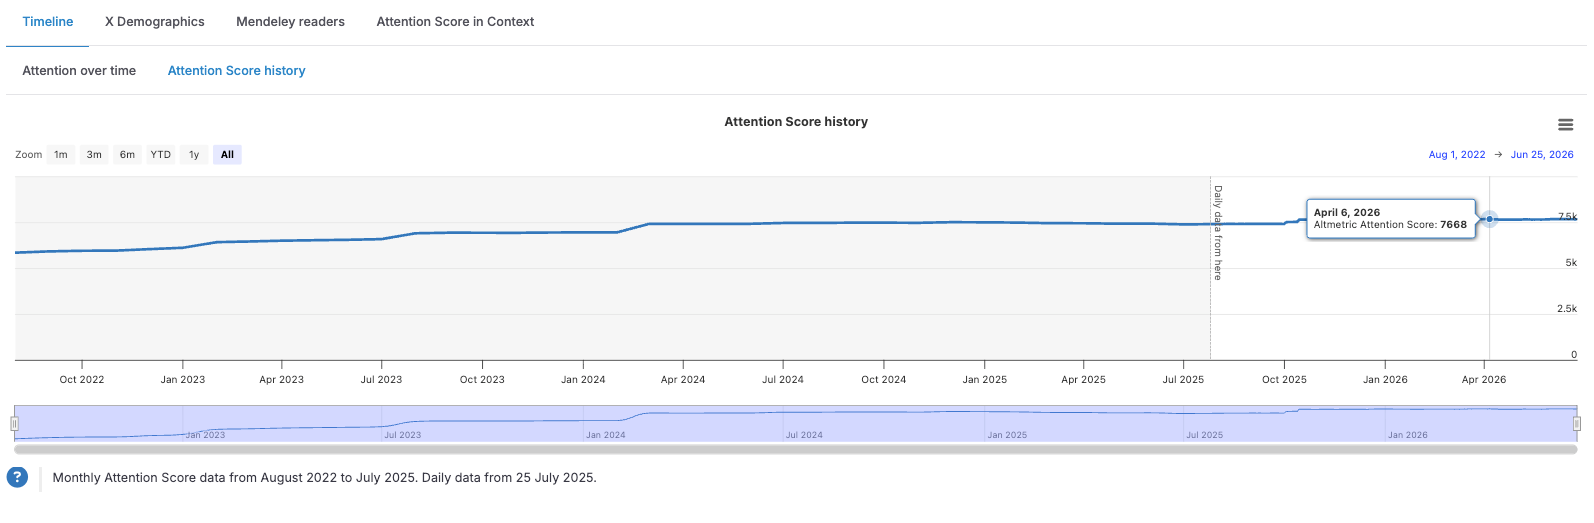
Interactive tooltips are generated only when a score change is actively recorded. If the score remains unchanged between two dates, no tooltips will appear for that period. The line will simply connect the two points of change, indicating a period of stable attention.
The chart shows the history of the Altmetric Attention Score as a single line. Source-level breakdowns are not available, as the score is a composite measure that cannot meaningfully be separated by source.
Please contact the Altmetric Support team for any further questions, we'll be happy to help!